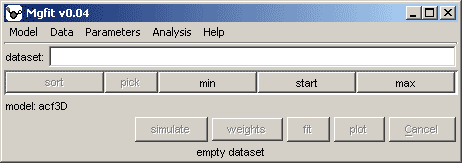
gfit is designed for model-based analysis of experimental data. Its goal is to provide a wide array of statistical tools that can be used with various computational models and collections of experimental data. To achieve this flexibility, gfit employs a modular design providing interfaces for computational models, optimization engines, and other statistical tools.
Current version of gfit allows simultaneous fitting of different experiments to a gfit model for MATLAB. The types of experiments that can be analyzed and the parameters that can be estimated are defined by the model. The gfit model can be any program that uses certain input variables to calculate its output variables. gfit model should contain meta information describing its input and output variables.
Each variable can contain a single number or an array of numbers. In other words, variables contain N-dimensional arrays with N ranging from 0 up. For example, a variable may represent the initial concentration of a reacting specie (0D-array), a dissociation constant (0D), a column of measurement times (1D), or concentrations of many reacting species at different times (2D-array). The description of gfit model defines dimensions of each variable and the kind of values it may contain. gfit guaranties that the input data provided to the model for simulation are within the limits specified by the model description.
The collection of input variables received by gfit model should provide sufficient information for simulating one experiment. The model does not distinguish between the variables that are precisely known experimental conditions and the variables representing unknown parameters. The distinction is made by gfit. Based on the description of the model and on the user-supplied experimental data, gfit uses some variables for generating fitting parameters. Each parameter can be linked to one or to many numerical elements of a variable from one or more experiments.
Mgfit comes as a zip-file containing the latest gfit jar library and
Matlab m-files. After unzipping the archive to your hard disk
(e.g. to D:\Mgfit), gfit.jar can be started directly. To run
the program under Matlab, set Matlab's Current Directory to
D:\Mgfit and type mgfit in Matlab command line.
You may be asked to restart Matlab to complete the installation.
Outside of Matlab, gfit can open model and dataset files, manipulate optimization parameters and plot data. To create datasets and run simulations the program has to be started under Matlab v6.5 (release 13) or later, as described above. For data fitting, Matlab's Optimization Toolbox is required.
The ability of gfit to 'understand' data is based on the model
description. Therefore specifying a model always comes as the first step.
Models can be loaded from three different
file types: from MATLAB *.m-files that contain gfit model
description, from gfit model *.gfm-files, or from gfit
dataset *.gfd-files, which always contain model description along
with the data. To load a model, select
→.
The model name is now displayed in the low left of gfit window.
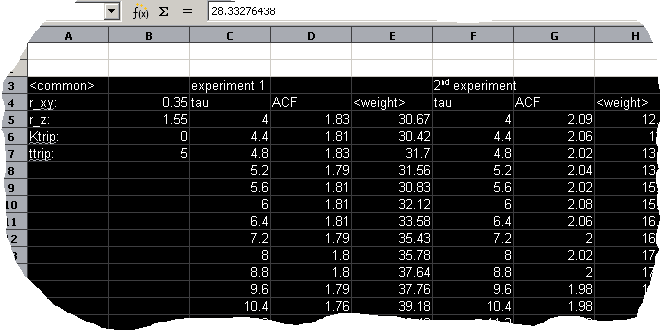
Once the model is loaded, gfit can interpret data from the experiments supported by the model. The experimental data can be arranged inside your favorite spreadsheet application and pasted into gfit. Using this method, 0-, 1-, and 2- dimensional variables can be imported.
To be recognized
by gfit, the data has to be arranged into experiments and variables.
Each experiment should have a name (name cannot be just a number) appearing in
the top row
of the dataset. The variables for the experiment should appear below
and to the right from the experiment name. The values for
each variable should appear below and to the right from the variable
name. A value for a scalar variable can be placed directly to
the right from the
variable name; in this case, variable name should
be followed by the colon. Dependent variables (the variables
that are measured in the experiment) can be followed by their
statistical weight. The weight should be labeled with a tag
<weight> and should have same
dimensions as its variable.
The names of the variables are defined in the model description. To learn the recognized names and to obtain a sample data structure for an experiment, choose → and paste the contents of the clipboard into the spreadsheet.
Once the dataset is prepared, it can be imported to gfit. Select the block of spreadsheet cells containing the data starting from the row containing names of experiments and copy the selection into clipboard. In gfit choose →.
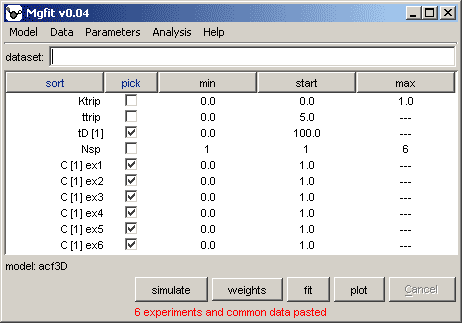
Once the model and data are loaded, gfit generates and displays the model parameters. Parameters provide a convenient way to change values of the input variables that the model uses for simulation. Each parameter can change one or many variable values in one or in many experiments. To check what variable elements the parameter is connected to, select the parameter's name and choose →. To change the connection, choose → or →.


